
Gaza Strip: Mapping Infrastructure Destruction
Repeat pass InSAR processing is used to measure building destruction by comparing building elevations before and after October, 2023
5/8/20254 min read
Introduction to Infrastructure Damage in the Gaza Strip
In the context of ongoing conflict, the Gaza Strip has experienced significant destruction of its infrastructure. This destruction is captured in a series of maps that illustrate the building heights before and after the escalation that began on October 7, 2023. By utilizing the advanced technique of repeat pass InSAR from the Sentinel-1 radar constellation, we have been able to analyze and quantify the extent of damage with unprecedented clarity. At the end of this post is an interactive map viewer allowing you to view the entirety of the analysis.
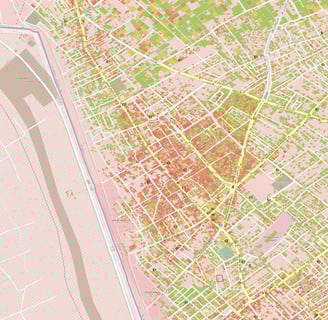
Hamad Town was a large apartment complex. Displayed are the measured height changes in meters applied to building footprints from Open Street maps.
Visualizing the Impact: Comparative Maps
The maps generated from this analytical process offer a stark visual representation of the destruction. By comparing the heights of buildings pre- and post-conflict, we gain insights into how infrastructure has been irrevocably altered within the Gaza Strip. These datasets highlight the dramatic changes in building heights over time.
Utilizing Sentinel-1 radar data that provides a detailed resolution of 14 meters we can accurately observe the height changes of infrastructure in meters. The differences observed in these maps are indicative of the level of devastation and the immediate impact on community resources and living conditions as of the end of 2024.
Large Area Maps
The following presents a high level view of the north, central and of the Gaza Strip. Presented are the changes in elevation measured in meters using repeat pass Interforometry (InSAR) from data collected by the Sentinel-1 radar constellation.
North Gaza
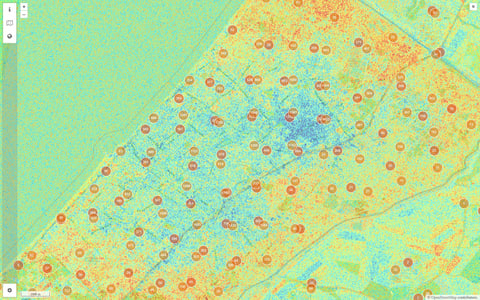
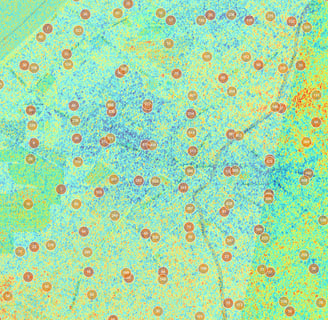
The colormap in this image displays the change in building heights for Gaza City north to the border of the Gaza Strip. The color ranges shows changes in meters from -10 to +10 meters (blue to red).
The dots indicate the number of buildings that have been reduced in height with Red dots indicating a reduction of more than 5 meters and yellow indicating building lowers by 2-5 meters.
Khan Yunis
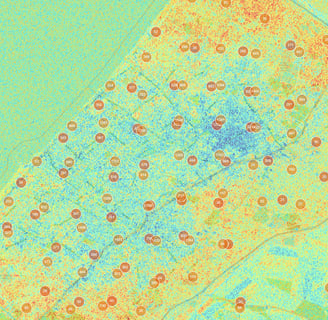
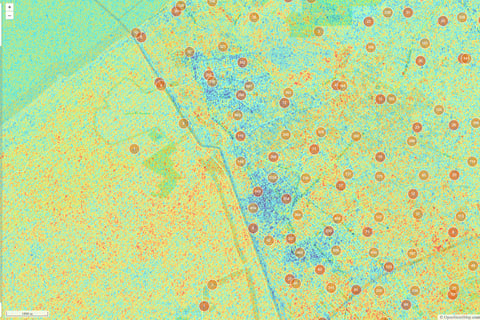
The colormap in this image displays the change in building heights for Khan Yunis in the middle of the Gaza Strip. The color ranges shows changes in meters from -10 to +10 meters (blue to red).
The dots indicate the number of buildings that have been reduced in height with Red dots indicating a reduction of more than 5 meters and yellow indicating building lowers by 2-5 meters.
Rafa
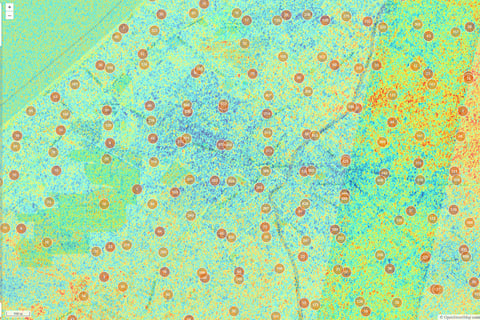
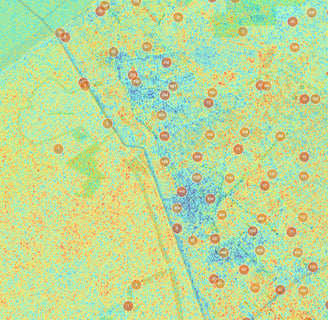
The colormap in this image displays the change in building heights for Rafa in the south of the Gaza Strip. The color ranges shows changes in meters from -10 to +10 meters (blue to red).
The dots indicate the number of buildings that have been reduced in height with Red dots indicating a reduction of more than 5 meters and yellow indicating building lowers by 2-5 meters.
Neighborhood Maps
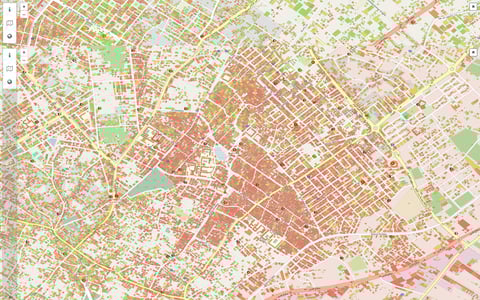
The following presents a detailed view of the estimates of infrastructure damage where the average height reduction has been applied to building footprints extracted from Open Street Map. Building polygons are grouped as follows:
Red - Average building height reduced by more than 5 meters
Orange - Average building height reduced by 2 to 5 meters
Yellow - Average building height reduced by 0.5 to 2 meters
Green - Average building height reduced by less than 0.5 meters
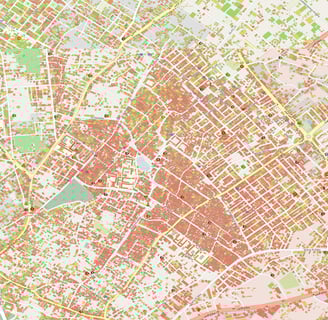
Jabalya
Average elevation changes in Jabalya. Red indicates a reduction of building height in excess of 5 meters indicating near complete destruction of the region.
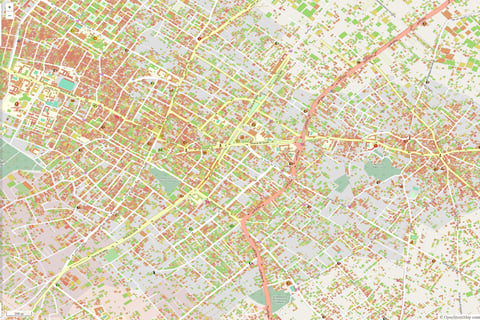
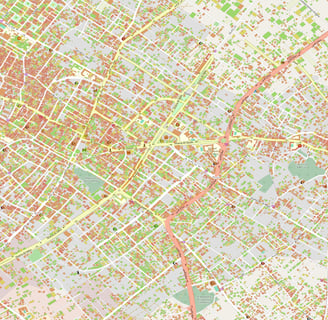
Khan Yunis
Average elevation changes in Khan Yunis. Red indicates a reduction of building height in excess of 5 meters indicating near complete destruction of the urban regions and green indicating limited damage away from city centers.
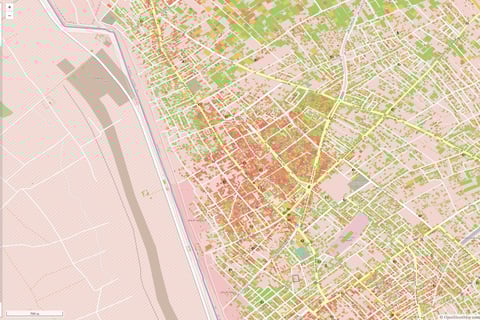
Khirbat Al-Abas, Rafa
Average elevation changes in the south east of Rafa. Red indicates a reduction of building height in excess of 5 meters indicating near complete destruction of the urban regions and green indicating limited damage away from city centers.
Understanding the Datasets and Their Implications
The datasets derived from radar imaging serve not just as a tool for measurement but as a poignant reminder of the humanitarian crisis unfolding in the region. The technique employed, repeat pass InSAR, allows for the detection of changes in landscape and structure, thus revealing the severe disintegration of the built environment. This method is crucial in understanding the broader implications of the destruction, including displacement of communities, loss of livelihoods, and the challenges of future reconstruction efforts.
As the conflict continues into 2025, the urgency to address these infrastructural damages becomes increasingly important. Policymakers and humanitarian organizations must engage with this data to formulate effective responses that not only address immediate needs but also lay the groundwork for long-term recovery. Ultimately, the maps created from these sophisticated datasets serve not only as a record of destruction but also as a call to action to rebuild and restore hope for the residents of the Gaza Strip.
Gaza Strip Interactive Map View
This map viewer provides access to all the layers presented. It is best viewed on a desktop as vector layers such as building footprints are disabled on mobile browsers. Presented in red are the buildings which have been lowered by an average of more than 1 meter.